Chance for Pregnancy with and without Clear Passage®
There is no substitute for published facts.
If you are serious about reversing your infertility, there is no substitute for reliable data published in peer-reviewed medical journals. The studies cited in these pages are indexed in PubMed, the ‘gold standard’ search engine maintained by the U.S. National Institutes of Health (NIH).
Additional data comes from the U.S. Centers for Disease Control (CDC) database of success rates for U.S. reproductive clinics. To allow time for live births and data collection, the CDC report shows results of procedures performed 2 to 3 years prior.
Published Pregnancy Rates Treating
Age and High FSH Related Infertility
-
Clear Passage 39.34%
-
Clear Passage®, then IVF 56.16%
-
IVF alone: 24.11%[i]
Pregnancy Rates for Clear Passage – 39.34%
48 of 122 women conceived, 43 natural and 5 via IVF
Pregnancy Rates for Clear Passage®, then IVF 56.16%
The 56.16% figure reflects the overall success rate for all ages. Individual age groups are shown in a table below using data from the CDC and a published study[ii] that examines Clear Passage® rates.
The table below compares pregnancy rates after embryo transfer for IVF with and without a course of our therapy given within 15 months before starting an IVF cycle. Simply view your age group in the table below to understand our “combined rate” for IVF following Clear Passage® therapy.
Calculated by an independent biostatistician, these results show a very high statistical significance (credibility) in all age categories. This data gives a very good picture of the advantage of using Clear Passage® therapy before IVF.
IVF Pregnancy Rates With & Without Clear Passage®
| Age Group | Rate with CP Therapy | Rate without CP Therapy | Statistical p-value |
|---|---|---|---|
| Under 35 | 68% | 45% | 0.0067 |
| 35-37 | 60% | 37% | 0.0133 |
| 38-40 | 49% | 29% | 0/0107 |
| 41-42 | 54% | 19% | 0.0039 |
| Over 42 | 44% | 9% | <0.0001 |
Note: all p-values in this chart are statistically significant
Percentages are rounded to whole numbers
Pregnancy Rates for IVF alone (USA) 24.11%[iii]
Advantages of IVF
- Physician monitored
- Whether success or failure, results occur quickly
- Additional eggs may be saved for future transfers
Disadvantages of IVF
- If unsuccessful, attempt must be repeated
- Must be repeated for every desired pregnancy
- May involve surgery to remove one or both fallopian tubes
- Involves pharmaceutical medications some may wish to avoid
- Not shown to improve intercourse pain or sexual function
Worldwide IVF Success Rates
-
United States: 24.11%[iv]
-
United Kingdom: 2% to 29%[v]
-
Japan: ~ 5%[vi]
-
Australia / New Zealand: ~10% to 15%[vi]
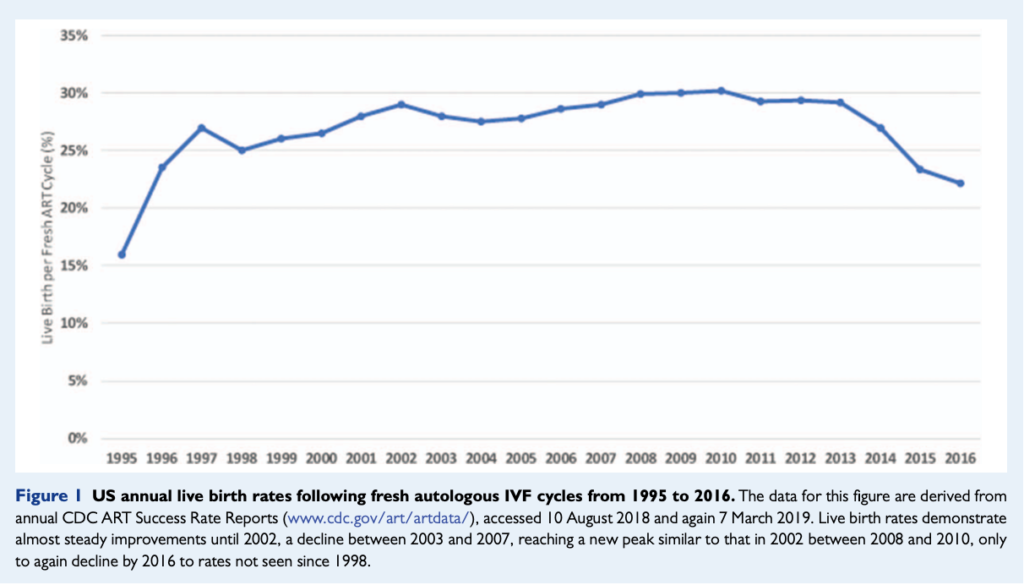
Several studies examine worldwide success rates for IVF. Most note a significant decline in pregnancy rates over the last 10 – 12 years[vii] as shown below.
United States IVF rates:
In vitro fertilization (IVF) is often suggested for women with blocked fallopian tubes. Based on CDC’s 2018 Fertility Clinic Success Rates Report, the 306,197 ART cycles performed at 456 reporting clinics in the United States during 2018 resulted in 73,831 live births. Based on the above, CDC shows a 24.11% national success rate for Assisted Reproductive Techniques in the USA, 99% of which are IVF. Some cycles were designed for ‘egg harvesting’ with the intent of using those eggs in later transfers which makes more exact results difficult to tabulate. Thus, we made further inquiry with results shown below.
Worldwide and US Downward Trend in IVF Success:
A 2019 study[viii] of two decades of IVF pregnancy rates showed a downward trend in worldwide and US IVF pregnancy rates starting in 2010. The study notes that US live birth rates for fresh cycle IVF or ICSI reached a high in 2008, plateaued till 2010 and have since steadily declined with profound drops between 2013 and 2016, the last year cited in the study.
United Kingdom IVF Rates: 2% to 29%
The British National Health Service (NHS) reports[ix] that between 2014 and 2016 the percentage of IVF treatments that resulted in a live birth was:
- 29% for women under 35
- 23% for women aged 35 to 37
- 15% for women aged 38 to 39
- 9% for women aged 40 to 42
- 3% for women aged 43 to 44
- 2% for women aged over 44
Other countries
IVF rates in Japan and in (combined) Australia and New Zealand cited in the study were:
-
Japan: ~ 5%[vi]
-
Australia / New Zealand: ~10% to 15%[vi]
[i] https://www.webmd.com/infertility-and-reproduction/guide/in-vitro-fertilization#3
[ii] Rice AD, Patterson K, Wakefield LB, Reed ED, Breder KP, Wurn BF, King CR and Wurn LJ. (2015a). Ten-year retrospective study on the efficacy of a manual physical therapy to treat female infertility. Alt Ther Health Med, 21(3):32-40.
[iii] https://www.webmd.com/infertility-and-reproduction/guide/in-vitro-fertilization#3
[iv] https://www.cdc.gov/art/artdata/index.html
[v] https://www.nhs.uk/conditions/ivf/ Kushnir VA, Barad DH, Albertini DF, Darmon SK, Gleicher N. Systematic review of worldwide trends in assisted reproduction 2014–2013. Reprod Biol Endocrinol 2017a;15:6.
[vi] Kushnir VA, Barad DH, Albertini DF, Darmon SK, Gleicher N. Systematic review of worldwide trends in assisted reproduction 2014–2013. Reprod Biol Endocrinol 2017a;15:6.
[vii] Gleicher N, Kushnir VA, Barad DH. Worldwide decline of IVF birth rates and its probable causes. Hum Reprod Open. 2019;2019(3):hoz017. Published 2019 Aug 8. doi:10.1093/hropen/hoz017
[viii] Gleicher N, Kushnir VA, Barad DH. Worldwide decline of IVF birth rates and its probable causes. Hum Reprod Open. 2019;2019(3):hoz017. Published 2019 Aug 8. doi:10.1093/hropen/hoz017
[ix] https://www.nhs.uk/conditions/ivf/
[x] Kushnir VA, Barad DH, Albertini DF, Darmon SK, Gleicher N. Systematic review of worldwide trends in assisted reproduction 2014–2013. Reprod Biol Endocrinol 2017a;15:6.
[xi] Liakakos, T., Thomakos, N., Fine, P., Dervenis, C., & Young, R. (2001). Peritoneal adhesions: etiology, pathophysiology, and clinical significance. Recent advances in prevention and management. Dig Surg, 18(4), 206–273.


